Shipping more than ever—or just think you are? Let's measure it.
Every team thinks they're shipping fast. Most have no way to prove it. Here's a self-hosted dashboard architecture that turns GitHub, ADO, and Cursor data into one honest view.
- engineering
- dashboard
- mcp
- ai-sdk
- nextjs
- open-source
John Ryan Cottam 4 min read
Shipping more than ever—or just think you are? Let’s measure it.
Every engineering team has a vibe about how productive they are. Some weeks feel fast. Some feel like nothing landed. But when someone asks “how much did we actually ship this quarter?” — the answer is usually a shrug, a Jira query, or a manager’s best guess.
The data exists. Commits, PRs, lines changed, cycle times, AI token spend — it’s all sitting in GitHub, Azure DevOps, and your Cursor analytics. Nobody assembles it because it’s spread across four tabs and three logins. So the conversation about output stays subjective.
What if it didn’t have to be?
Momentum: one dashboard, one date picker
I built a tool called Momentum that pulls all of it into one view. One page, one date picker, five presets: this week, last week, 30 days, 60 days, YTD.
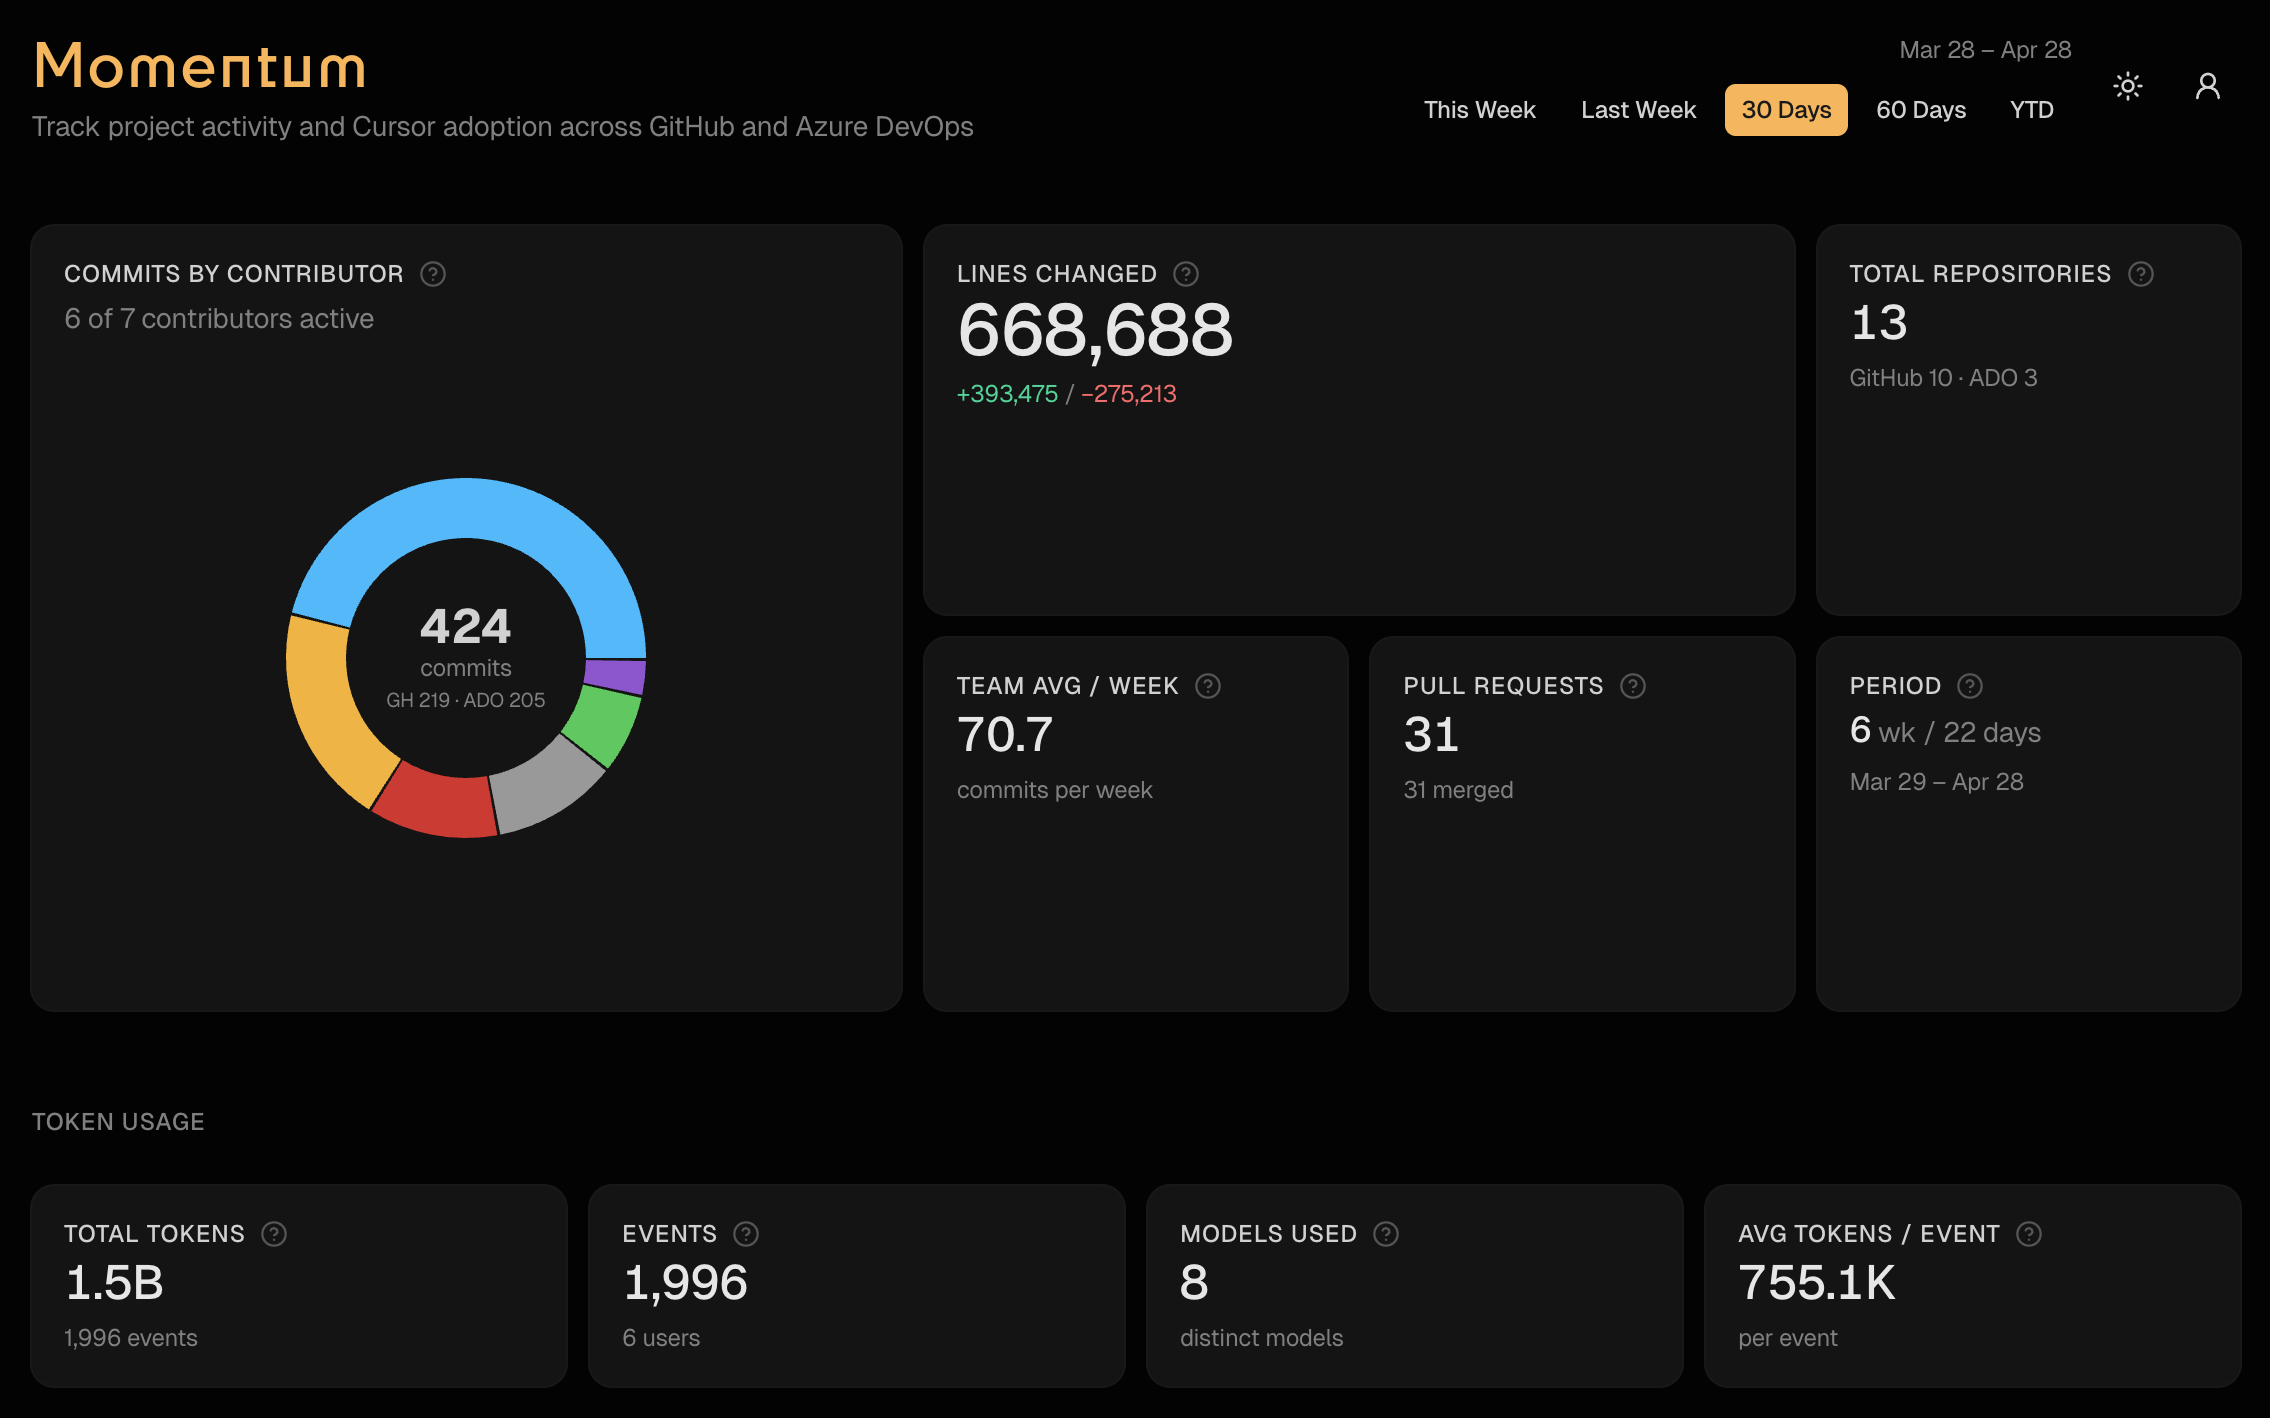
- Commits and PRs across GitHub orgs and Azure DevOps — with per-contributor breakdowns
- Lines changed — additions, deletions, net. Tells you who’s building and who’s refactoring
- PR cycle time — opened to merged. Shows where reviews are fast and where they bottleneck
- Cursor adoption — agent vs Tab vs manual edits, per repo. Are your engineers actually using the AI tools you’re paying for?
- Token spend — by user, by model. Budget visibility without digging through billing dashboards
- A chat interface that answers any of the above in plain English
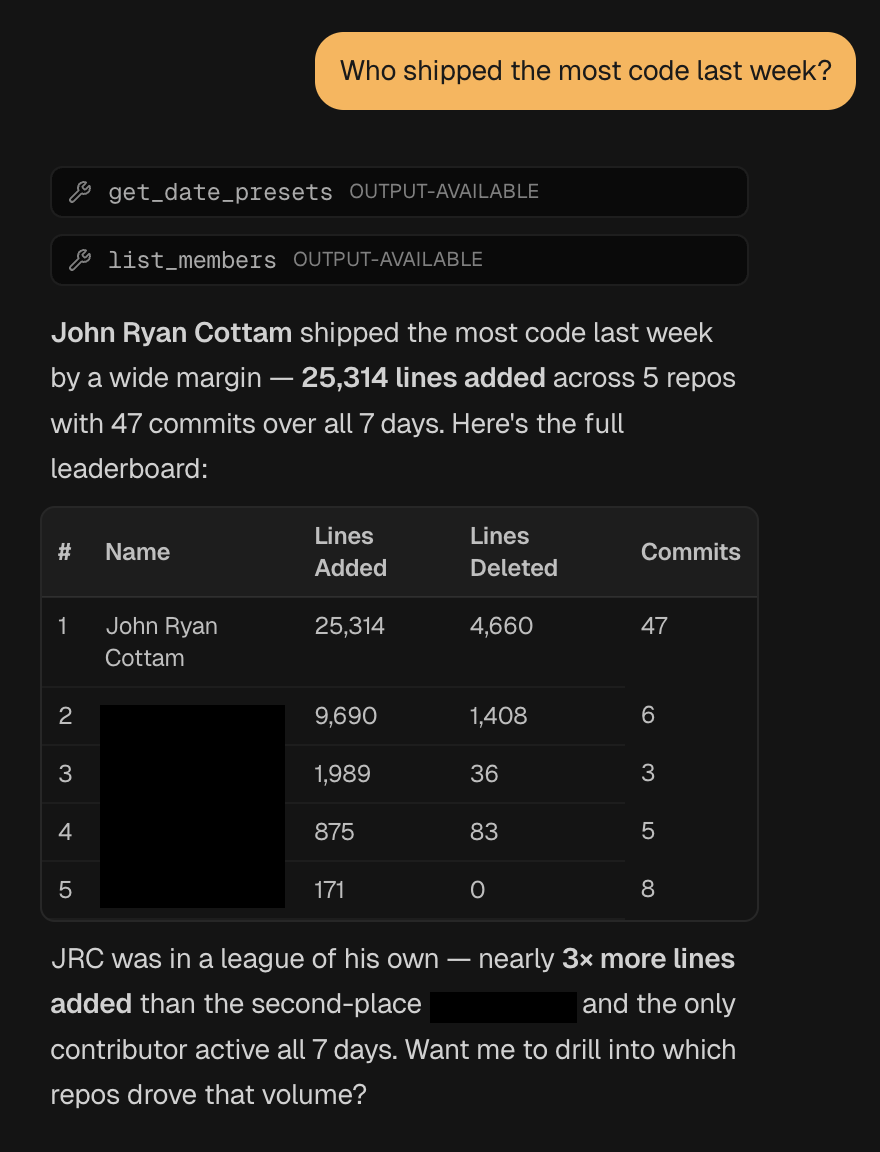
That last one is the part that changes how teams use it. Instead of scanning tables, you ask: “Who shipped the most code last week?” or “What did we spend on Claude in the last 30 days?”
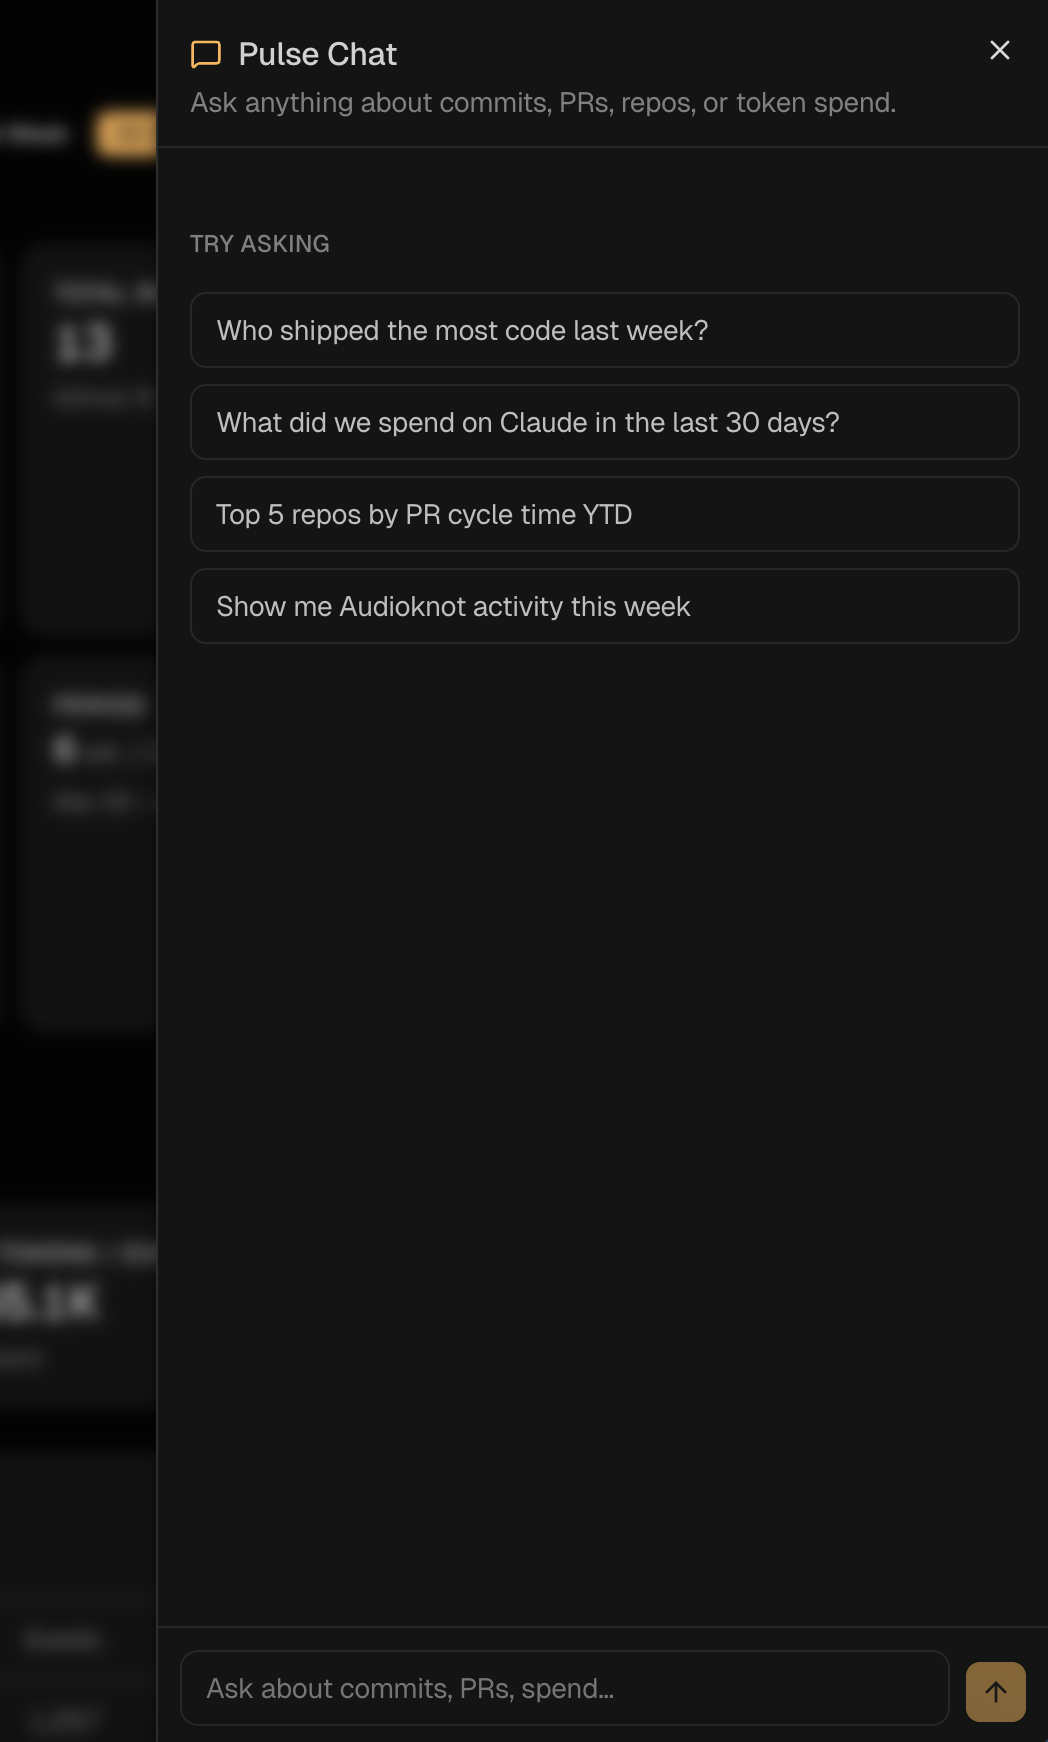
It calls the right tools, assembles the answer, and gives you a formatted response with the numbers to back it up.
The architecture worth stealing
The interesting part isn’t the dashboard — it’s how it works under the hood. Three files do all the heavy lifting.
One cached corpus. A single year-to-date pull of GitHub, ADO, Cursor, and token data, cached for an hour. The dashboard, the chat, and the MCP server all slice from the same in-memory snapshot. Your APIs get hit once per hour, not once per question.
export const getRawCorpus = async (): Promise<RawCorpus> => {
  "use cache"
  cacheLife("hours")
  cacheTag("dashboard-data")

  const ytd = RANGE_PRESETS.ytd.resolve()
  const [github, ado, cursorEdits, userContributor, tokenUsageRows] =
    await Promise.all([
      fetchGitHubData(ytd.since, ytd.until).catch(() => emptyGitHub),
      fetchAdoData(ytd.since, ytd.until),
      getLatestCursorEdits(),
      getLatestUserContributor(),
      loadTokenUsageRows(),
    ])

  return { since: ytd.since, until: ytd.until, github, ado, cursorEdits, userContributor, tokenUsageRows }
}
One tool registry. Twelve tool() definitions — get_team_summary, list_members, get_pr_stats, get_token_usage, get_cursor_edits, and so on. Each takes a Zod schema and returns structured JSON.
export const momentumTools = {
  get_team_summary: tool({
    description: "Top-line metrics for a date window: commits, contributors, lines, GitHub vs ADO split.",
    inputSchema: windowSchema,
    execute: async ({ since, until }) => getTeamSummary(since, until),
  }),
  // ...11 more
}
Two transports, same registry. The chat route hands momentumTools to streamText. The MCP route hands the same object to createMcpHandler. That’s the entire integration:
// /api/chat
const result = streamText({
  model: CHAT_MODEL,
  system: MOMENTUM_SYSTEM_PROMPT,
  messages: await convertToModelMessages(messages),
  tools: momentumTools,
  stopWhen: stepCountIs(8),
})

// /api/mcp
const mcpHandler = createMcpHandler((server) => {
  for (const [name, tool] of Object.entries(momentumTools)) {
    server.registerTool(name, { description: tool.description, inputSchema: tool.inputSchema }, ...)
  }
})
Adding a thirteenth metric is a one-file change. Define the tool, ship it, and it shows up in both the chat and the MCP endpoint. No duplicate definitions, no drift.
Most public examples wire AI SDK chat tools and MCP tools as separate codepaths. They don’t have to be. This shared-registry pattern is the cleanest seam I’ve built in a while.
What it takes to run this on your team
The org-specific bits are pinned to one file — src/lib/authors.ts — which holds author aliases, display names, and bot exclusions. Everything else is configurable:
- Org list — GitHub orgs and ADO org as env vars
- Author config — one file with a starter template
- Cursor data — detect-or-disable so teams without it still get the core dashboard
The infrastructure is all pluggable: Supabase auth, Vercel Blob storage, AI Gateway, MCP. Standard tools any team running on Vercel already has access to.
Why this matters
Engineering visibility shouldn’t require a SaaS subscription. The data is already in your repos — you just need something to assemble it.
When every engineer on the team can see the same numbers, the conversation about output changes. People either step up because the scoreboard is visible, or they finally have data to back up a heavy week. Both outcomes are good.
If you’d run this on your team, let me know. I’m working on an open-source version and documenting the process as I go.
Resources
- Momentum repo (open-source version coming soon)
- Vercel AI SDK
mcp-handler- Build MCP Servers on Your Favorite Stack — the prior post on the MCP transport that powers this
- Model Context Protocol spec